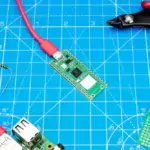
Today we’re introducing a simple solution to install everything you need to develop for Raspberry Pi Pico, and for other RP2040-based boards, using C or C++ on Windows.
If you want to get started with the Raspberry Pi Pico C SDK it can initially seem quite daunting. There are a lot of moving parts to install before you can blink your first LED on, and then off again, especially if you want proper debugging using something like our new Debug Probe. While there has been a “one click” solution to install the toolchain on a Raspberry Pi since launch — see Chapter 1 of the Getting Started guide — installing the toolchain on other platforms like Apple’s macOS, or Microsoft’s Windows, has always been a little more difficult.

When we launched Raspberry Pi Pico and its SDK, our assumption was that people would be happy with a Linux-based toolchain. However, we also documented how to get the toolchain up and working on both Apple’s macOS and Microsoft Windows for folks that wanted to use those platforms. Unfortunately, while installing the SDK on macOS isn’t too different from doing so under Linux, and works almost out of the box, installing things on Windows is much more difficult; it’s just a very different environment.
Fortunately, an enterprising young engineer called Nikhil Dabas decided to see whether he could do better. It turned out, of course, that he could, so I asked him to help us create something even better: a complete integrated installation package that would give people a nice, easy way of building and debugging the Pico-SDK.
Installing the toolchain
Installing the toolchain is now as simple as downloading, and running, the Pico Installer.
At the end, the installer will offer to clone and build the Pico examples, giving you the option of changing where the examples are installed. Leave that ticked, and the installer will open a command window to do the initial checkout and build of all the Pico repositories. Once done, you can safely close this window.
Starting Visual Studio Code
In your Start Menu, look for the “Pico – Visual Studio Code” shortcut, in the “Raspberry Pi” folder. The shortcut sets the required environment variables and then launches Visual Studio Code.

The first time Visual Studio Code is launched using the Start Menu shortcut, it will open the pico-examples folder. To open the folder later, use the “Open Recent” or “Open Folder” menu options and navigate to your Documents/Pico-v1.5.0/ directory, or wherever you installed the examples.
Building the Hello Serial example
If you previously didn’t have VS Code installed, everything should ‘just work’ after installation. But often we’ve seen problems due to various random settings inserted by other extensions, or by the user, in an existing installation. If this is the case for you, please go to the Pico Installer Wiki for a checklist of known issues and solutions.
Visual Studio Code may ask if you want to configure the pico-examples project when it is first opened; click “Yes” on that prompt to proceed, if you miss the prompt look for the ‘bell icon’ in the bottom right. If it doesn’t ask, you can click on the blue status bar where it says ‘No active kit’ and select Pico ARM GCC.
To build the example, click the CMake button on the sidebar. You should be presented with a tree view of the example projects; expand the ‘hello_world’ and ‘serial’ trees, and click the small ‘build’ icon to build that specific project. You should take a note of the [hello_serial] tag down in the CMake toolbar at the bottom of the screen, you can use this to change the target at any time.
Debugging your example application
To debug your hello_serial example, you should use the new Raspberry Pi Debug Probe or set up your own PicoProbe using a second Raspberry Pi Pico. If you don’t have a Debug Probe, see Appendix A of the Getting Started guide for instructions on setting up a second Pico as a PicoProbe.

To quickly check you’ve set this up properly, in Visual Studio Code, click on the SERIAL MONITOR tab. When you plug in your Debug Probe (or PicoProbe) you should see an additional COM port in the port drop-down list. You should leave the baud rate set to the default of 115,200 in most cases.
Click ‘Start Monitoring’ to open the serial port.
Let’s start debugging
Assuming you have wired up the Debug Probe to your Pico correctly, press F5 to start debugging or click the Run and Debug button (Ctrl-Shift-D) on the sidebar and then small ‘play’ icon at the top of the debug window.
Your selected target should now be built, uploaded, and started. The debugger interface will load and will pause the execution of the code at the main() entry point. At this point, you can use the usual debugging tools to step, set breakpoints, inspect memory, and so on. Hit “Run”, and you should now be able to switch back to the SERIAL MONITOR tab to see the serial output appear.
Next steps
For more information about creating your own project outside of the pico-examples see the tutorial in the code, or look at Chapter 8 of the Getting Started guide for a full walkthrough.


