This free, open source tool has a neat ncurses-based UI that shows a real-time graph of signal strength for the wireless network you’re currently connected to.
While this tool won’t make your wi-fi faster or coax signal into network dark spots it will allow you to see a whole host of information at a glance, including:
- Link quality
- Signal to noise
- Packet statistics
- Device config
- Network info
There are several different screens, each relaying different information.
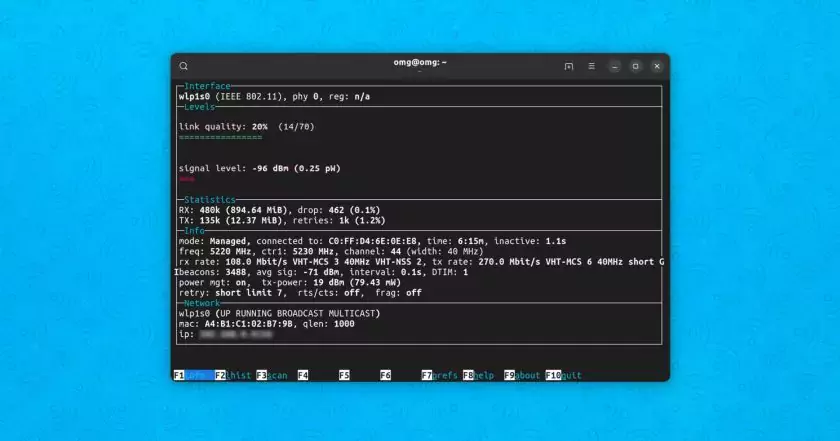
The default “info” screen (F1) gives a good overview with graphs showing signal quality and signal level in dBm, as well as noise level in dBm and SNR in dBm on hardware that supports it.
You also get to see real-time packet stats, detailed connectivity information , and finally network info including IP address, network device name, and so on.
Dive into the “level histogram” (F2), “scan” panel (F3) or “prefs” (F7) if required.
Helps You Troubleshoot Wi-Fi Issues
Is Wavemon useful? I think so.
Being able to see fine-grained, up-close info about your network config including the strength and relatively quality of your wifi connection may help troubleshoot issues. It will also give you some ideas on how to optimize your setup to potentially improve your connection.
Plus, curious folks like me can use Wavemon to compare how different networks (e.g., dual band wi-fi) perform on the same device/location, or see how a network performs on different devices and/or areas of the house.
Installing Wavemon is Easy
Wavemon is free, open-source software that works on all Linux distributions. You can install it from the repos using your system’s package manager, e.g., sudo def install wavemon on Fedora, sudo apt install wavemon on Debian/Ubuntu, etc.
Source code can be found on GitHub.
Try it out — and if you know of similarly useful CLI apps like this do give me a shout!